As we head into Q3, the market seems ready to leave some key issues of the last 12-18 months in the rearview. Aside from 25 bp hike in July, the Federal Reserve appears to be signaling the end of its hiking cycle. This shift in strategy comes as recent prints suggest that while inflation remains elevated above the Central Bank’s 2% target, the data seems to indicate a clear and stable downward trend, at least in the US. As these developments converge, the probability that the Fed will ultimately succeed in engineering a “soft landing” appears increasingly likely, and chatter about a severe recession has all but completely dissipated.
In turn, clarity and/or resolution around these issues have led equity market participants to direct their focus on earnings expectations to inform their allocation decisions. With the overall market in the US implying a 7% drop in earnings for the year, allocators have shifted their attention toward two key asset classes/strategies:
- High growth equities showing solid revenue and both near- and long-term earnings growth driven by the burgeoning impact and influence of generative AI and LLMs (Large Language Models)—more on this later.
- The haven of Treasuries and Private Credit, both of which give portfolios reliable returns and portfolio stability.
Broadly speaking, the first half of 2023 showed strength in key global economies, despite the rising rates and inflationary pressures. The US economy was led by strong consumer spending, and stronger than expected corporate earnings. A recovering Europe and re-emerging China—spurred on by a shift from restrictive Covid policies—continued to contribute to global growth. Across markets, higher interest rates began to create a growing dispersion between winners and losers.
The US economy has remained particularly strong despite tightening financial conditions, persistent services inflation, and continued geopolitical turmoil. Its persistence has been led by a healthy consumer base, a robust labor market, and strong corporate balance sheets. However, European economies have also proven remarkably resilient despite the ECB’s own hawkish rate regime (the Bank has raised rates 375 since beginning its hiking program) and generally speaking continues to produce positive economic growth, having largely resolved the disruptions to its supply chains stemming from the war in Ukraine.
However, neither the Fed nor the ECB will be rolling back their tight fiscal policy any time soon, and the higher-for-longer interest rate programs will create clearer winners and losers in both the equity and credit landscapes. Markets saw dramatic dispersion between sectors in May as the reality of strong revenues, high margins, and solid earnings helped blue-chip tech stocks to soar above the more varied performance of the broader markets.
In general, however, asset prices have varied widely but continued to post gains in the second quarter. The Move Index, which tracks bond volatility, spiked to its highest level since the Global Financial Crisis, driven largely by turbulence in the banking sector and mixed inflation outlooks. In contrast, however, equity market volatility such as the VIX remains low and range-bound (see chart below).

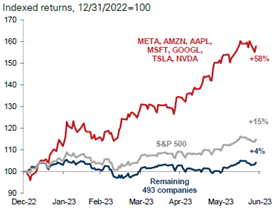
Looking ahead to the second half of 2023, slow liquidity growth, persistent (though diminishing) inflation risk, and tentative growth expectations will keep market volatility elevated. Despite the recent volatility, however, global equity markets had a deceptively strong first half: while market performance was solid, recent index gains were driven higher by the exceptional outperformance of the 7 largest-cap tech stocks. For reference, the market cap of the top performing stocks in the S&P (AAPL, MSFT, GOOG, AMZN, NVDA, TSLA, and FB) comprised 28% of the S&P 500 at the end of Q2, up from 20% at the start of the year. The spread between the index’s seven largest stocks and the rest of the index is at its widest since 2000: excluding these stocks, the S&P 500 would have returned just 4% YTD through Q2 (see chart below).
The rapid increase for the largest stocks has caused the NASDAQ to become overconcentrated according to its methodology. In late July, the index will execute a “special rebalance” to reduce the influence of MSFT, AAPL, AMZN and TSLA, which account for almost 44% of the index. The special rebalancing is designed to remain in compliance with the SEC’s rule on fund diversification and will take the aggregate exposure of those stocks down to 38.5%. Earnings forecasts show that inflows to big cap tech may not stop any time soon, as the top five stocks expect a 16% growth in profits compared to a decline of 7% for companies in the index overall. Short interest on the QQQ has decreased significantly from the highs earlier this year.
While the renewed optimism around these big tech names was driven in part by excitement around the growth potential for AI, more fundamental explanations can also help account for their recent outperformance. Many of these blue-chip tech names front-loaded their response to a tighter capital environment, executing broad layoffs and other cost-cutting measures in late 2022 and opening a path toward solid financial health in 1H23 despite persistent high rates and inflationary pressure.
Moving away from these names, growth equities more broadly led the S&P to a 16% gain through the first two quarters, with the Russell 2000 up 8.1% YTD. The S&P Equal-Weight Index (EWI) was up 8%, demonstrating the strong impact of the seven tech leaders but also the solid fundamental strength of large-cap companies more generally. The major indices are rife with sector dispersion however: demonstrably, commodities as a whole ended the first half of the year down -7.5%.
Bond Markets
In contrast, bonds performed in a more muted fashion given recent volatility, with the Bloomberg US AGG up just 2.1% YTD through June. While the end of the tightening cycle appears to be on the horizon, yields remain elevated with the 10 year ending June at 3.81% and the yield curve still inverted, with the 2 year at 4.87%. This inversion—its greatest since 1981—seems to imply coming economic weakness and a possible (likely mild) recession sometime in the next 4-21 months.
These indicators are representative of late cycle trends, as earnings overall are negative and are overall expected to end the year down roughly -7%. Coupled with lending stress and tighter loan conditions, this could lead to further credit tightening. With the resolution of the debt ceiling comes the imminent issuance of an influx of Treasuries to refill the Treasury General Account. With a hawkish Fed and US banks being net sellers of US Government bonds over the last few quarters, concerns around how the securities will be absorbed are causing downward pressure on the bond market. Defaults on speculative grade credit remain well below the 4% base forecast but are expected to tick up in the second half of this year. However, the market has demonstrated some resilience as ratings actions have become less negative so far in 2023.
Manufacturing activity in the US and other developing markets continue to decelerate. Many global economies face headwinds due to persistent inflationary pressures and tighter monetary and financial conditions. However, the global cycle has become increasingly asynchronous as Europe, China, and the US economies continue to diverge in many respects.
Nothing Artificial About It: The Imposing (and Enduring) Presence of Generative AI and LLMs
In speaking about AI, there may be nothing more illustrative than to let an LLM tell you about itself:
“In the ever-evolving landscape of global industries, the impact of generative AI and Large Language Models (LLMs) is poised to be nothing short of revolutionary. These groundbreaking technologies, with their ability to generate coherent text and analyze vast amounts of data, are set to transform multiple sectors, enhancing efficiency, innovation, and decision-making processes.
In healthcare, generative AI and LLMs offer tremendous potential. They can analyze patient data, medical records, and scientific literature, providing valuable insights for diagnosis, treatment plans, and drug discovery. By augmenting the capabilities of healthcare professionals, these technologies have the power to improve patient outcomes and revolutionize personalized medicine.
In the field of manufacturing and supply chain management, generative AI and LLMs can optimize operations and enhance productivity. By analyzing complex data sets, these technologies can identify bottlenecks, streamline processes, and predict maintenance needs, reducing costs and improving overall efficiency. Moreover, they can enable predictive analytics for demand forecasting, inventory management, and logistics optimization, ensuring timely delivery and minimizing disruptions.”
Open AI’s ChatGPT 3.5 produced the above when prompted to “write roughly 200 words of prose about how generative AI and LLMs will impact various industries.” If you haven’t had the opportunity to explore ChatGPT’s capabilities, we highly recommend you do so: it may be virtually impossible to understate, or to fully grasp, the near- and long-term impact that Artificial Intelligence will have on our productivity, across virtually all sectors and industries.
While stocks well-positioned to benefit from the adoption of AI (like MSFT and META) led the equity market surge in 1H23, the impact of Large Language Models (“LLMs”) and generative AI on both markets and industries has only just begun. Major first movers—like Microsoft, through its partnership with OpenAI—stand to massively extend their early lead. While technology connected to or developed in tandem with Artificial Intelligence will gradually diffuse throughout our economy’s bloodstream, app developers will need to draw on the major LLMs through APIs.
Companies like Microsoft and Meta have already established a formidable moat: the subset of software engineers with the expertise needed to develop large language models is limited. Analysts we’ve spoken to have estimated that of the roughly 300 engineers with the right skillset, the overwhelming majority have signed on to work with companies like Microsoft that have the resources, platforms, and intellectual property needed to help them realize their ideas.
“Thank you for entrusting us with your investments and being a part of our journey in Q2. As we move forward, our commitment to delivering strategic insights, informed decisions, and value-driven results remains unwavering. Together, we navigate the ever-changing markets, leveraging cutting-edge technologies to shape a prosperous future. Your success is our motivation, and we look forward to continuing this fruitful partnership in the quarters to come.”
— ChatGPT
Sincerely,
The Team at Appomattox
This document is being issued by Appomattox Advisory, Inc. and is for private circulation only. The information contained in this document is strictly confidential and may not be reproduced, distributed or published by any recipient for any purpose without the prior written consent of Appomattox Advisory, Inc. This document does not constitute or form part of any offer of asset management products or services in any jurisdiction. Furthermore, this document does neither constitute an offer of asset management products or services.
The value of investments and any income generated may go down as well as up and is not guaranteed. You may not get back the amount originally invested. Past performance is not necessarily a guide to future performance. Changes in exchange rates may have an adverse effect on the value, price or income of investments.
The information and opinions contained in this document are for background purposes only, and do not purport to be full or complete. No representation, warranty or undertaking, express or limited, is given as to the accuracy or completeness of the information or opinions contained in this document by any of Appomattox Advisory, Inc., its partners or employees and no liability is accepted by such persons for the accuracy or completeness of any such information or opinions. As such, no reliance may be placed for any purpose on the information and opinions contained in this document.
Significant differences in returns, risks and correlations may occur within sub-periods of the periods shown. Historical investment performance and market characteristics may not be indicative of future investment performance or market characteristics. There are frequently sharp differences between the hypothetical performance results and the results subsequently achieved by any particular trading or investment program.